International Journal of
eISSN: 2576-4454


Research Article Volume 6 Issue 4
1Faculty of Health Sciences, UFP Energy, Environment and Health Research Unit (FP-ENAS), Fernando Pessoa University, Porto, Portugal
2State University of Rio de Janeiro, Faculty of Engineering, Sanitary and Environmental Engineering Department, Rio de Janeiro, Brazil
Correspondence: Alfredo Akira Ohnuma Jr, State University of Rio de Janeiro, Faculty of Engineering, Sanitary and Environmental Engineering Department, Rio de Janeiro, Brazil, Tel + 55 21 995917373
Received: July 15, 2022 | Published: July 28, 2022
Citation: Barros R, de Almeida JCA, Bila DM, et al. A seasonal assessment of the qualitative and quantitative features of the urban waters of Canal do Anil, Rio de Janeiro. Int J Hydro. 2022;6(4):142-149. DOI: 10.15406/ijh.2022.06.00318
The purpose of this study is to assess the water quality of the Canal do Anil basin in Rio de Janeiro by taking account of seasonality, as well as quantitative and qualitative factors, based on a multivariate framework designed for the correlation of parameters and environmental conditions. The methodology involves collecting data from water samples at specific points in the basin. The concept of seasonality is represented on a temporal and spatial scale and based on the seasons, rainfall volume, parameters and water quality index. The results showed a worsening of the water quality from upstream to downstream, with a high concentration of total dissolved solids and turbidity, especially in the downstream channel. There is a tendency for greater dilution or movement of pollutants, depending on rainfall intensity, and a little evidence of a close correlation between the parameters analyzed. Climatic seasonality, related to rainfall and the observed flow rate, has an effect on improving water quality, which is aggravated by the high concentration of domestic and industrial pollution. The lack of basic sanitation in the region, especially a sanitary sewage system and a regular collection of solid waste, leads to conditions of environmental degradation in the Canal do Anil basin.
Keywords: multivariate analysis, urban waters, water pollution, water quality, water quality index
Degradation of water quality has become a global concern insofar as intensified human activities are overcoming our capacity to ensure the quality of environmental management systems and human health.1,2 The increase in the consumption and non-consumption demands for water resources, resulting from the increase in density of population, has been aggravated by the disorderly and uncontrolled settlements of the urban basins in a way that has affected the quality of the water bodies.3
In Brazil, the basic sanitation indicators are alarming when they concern public services. Data obtained from the National Information Management of the Sanitation Sector4 show that although water supply services and household waste collection are provided, on a national average, to 84% and 92% of the population respectively, the average in the country for sewage treatment is only 46%. The State of Rio de Janeiro has a 50% index for sewage collection systems and 31% with regard to sewage treatment.4
In light of this, owing to the growing population density and the substandard systems of basic sanitation in most towns and cities in Brazil, there are many cases of diseases in the low-income communities or informal settlements. This is owing to unsuitable basic conditions of hygiene, cleanliness and ways of cooking food, which directly affect the residents in a way that gives rise to higher rates of infectious diseases such as: cholera, measles, dengue fever, typhoid, AIDS, tuberculosis and other ailments.5,6
Data obtained from monitoring the quality of the water close to the urban communities is of crucial importance as a means of conserving the aquatic eco-system7 and public health, as well as providing information that can be shared with decision-making bodies, scientific researchers and the public at large. The systematic monitoring of the evolving pattern of the conditions of water quality, can provide data regarding alterations in the particular parameters and indicators and serve as tools and models for the management of water resources.
However, in Brazil there is a serious shortage of stations with data on the monitoring of the quality of the water of urban rivers and when these are available, they suffer from a lack of continuity and cannot be regarded as representative because of a scarcity of samples, in particular when the time data are analyzed.8–10
The monitoring of water resources in Brazil is carried out by institutions and public bodies (federal, State and municipal), each of which is responsible for keeping and passing on information to the decision-makers and general public. According to a report published by the Sanitation Basic and National Water Agency (ANA), (the public body of national jurisdiction in Brazil that is responsible for regulating water resources in the country and fulfilling the objectives and guidelines of the “Waters Act” (Law nº 9.433 of 1997), only nine States had systems for monitoring the quality of water that could be assessed as excellent, five were good or standard and thirteen were either poor or at an early stage of installation.11
The purpose of this study is to assess the quality of water in the Canal do Anil in the city of Rio de Janeiro by taking account of seasonality as well as quantitative and qualitative factors related to the multivariate framework for conducting an analysis of the correlation of the parameters and environmental conditions in the basin of the district of Anil.
The microbasin of the Canal do Anil is situated in the West of the city of Rio de Janeiro and is a part of the Guanabara Bay. It has an area of approximately 24.8 Km2, and is a tributary of the River Arroio Fundo, that flows into the Basin from Rio Grande, until it reaches the Camorim Lagoon, the Tijuca Lagoon and the Atlantic Ocean (Figure 1).
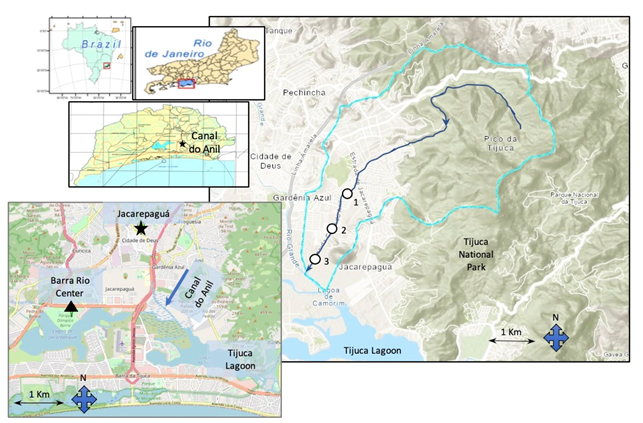
Figure 1 Boundary lines of the Canal do Anil microbasin, Rio de Janeiro and collection points (1, 2 and 3) of the water samples and the location of the pluviometric stations of Jacarepaguá (▲) and meteorological center of Barra Rio Center (★) in the region close to the Canal do Anil, Rio de Janeiro.
The district of Anil is located in the Administrative Region VI, called RA Jacarepaguá and is thus in the microbasin of Jacarepaguá, in Planning Area 4 (AP-4). The Canal do Anil region is predominantly residential. It covers an area that includes an old community of fishermen, together with a significant growth in urban occupation in the 1960s caused by real estate speculation and a movement from the central region to the outskirts of the city of Rio de Janeiro. There are reports from about 80% of the population who all state that more than once a year, there is heavy rainfall, landslides and flooding. Although the area is predominantly residential, there is an increased demand for water and industrial waste plants in the region of Canal do Anil, with about 65% of the connections being made at the beginning of the 1990s.12
This study examines analyses of monthly samples of water collected from the river at 3 different points of the Canal do Anil basin, with the following parameters: temperature, pH, electric conductivity (CE), dissolved oxygen (OD), turbidity, total dissolved solids (SDT), cadmium, lead, copper and total fecal coliforms. The geographical coordinates of the points in the WGS84 reference system are: Point 3: -22.97319, -43.35221; Point 2: -22.96441, -43.34615 and Point 1: -22.95385, -43.34191 (Figure 1).
This study analyzes the average results given by the water quality index (IQANSF) through the National Sanitation Foundation (NSF) method. These were obtained from the Canal do Anil in the period 2012-2018 (INEA, 2019), on the basis of representative parameters and balanced weights, as a means of classifying the results in a range of IQANSF categories such as: 90 ≤ excellent ≤ 100; 70 ≤ good < 90; 50 ≤ average < 70; 25 ≤ poor < 50 and very poor < 25.13
The analysis of the water quality was carried out in-situ by mobile multiparametric probing of the Horiba U-50 for the following physico-chemical parameters: temperature, pH, dissolved oxygen (DO), total dissolved solids (TDS), and turbidity. The analyses of the parameters for cadmium, lead, copper and thermotolerant coliforms were conducted ex-situ in a specialist laboratory, and in accordance with the methodology for the collection and preservation of the samples and the analytical techniques (APHA, 2005), shown in Table 1.
Measurement |
Parameters |
Method of Analysis |
In Situ |
pH |
|
Temperature |
|
|
Dissolved Oxygen (DO) |
Multiparametric probing with the Horiba U-50 model |
|
Total Dissolved Solids (TDS) |
|
|
Turbidity |
||
Ex Situ |
Cadmiim |
ICP MS – |
Lead |
USEPA 200.8 |
|
Copper |
||
Thermotolerant coliforms |
SMEWW 9221 B / 9223 A e B |
Table 1 Methods for analyzing the parameters of the quality of the water
Altogether, 12 campaigns were carried out involving monthly collections of water samples from the Canal do Anil, from December 2017 to November 2018. The dates for the collection were as follows: 13th December 2017, 26th January 2018, 23rd February 2018, 28th March 2018, 20th April 2018, 25th May 2018, 28th June 2018, 27th July 2018, 24th August 2018, 27th September 2018, 18th October 2018 and 7th November 2018.
The analysis of the results of the water quality samples obtained from the Canal do Anil was conducted through statistical processing by means of the Dynamic R (programming language), with boxplot data visualization graphics, including a correlation matrix and a principal components analysis (PCA).
The definition of the temporal scale employed is based on the seasons of the year.14 The volume of seasonal rainfall and average local temperature are obtained from the pluviometric center of Jacarepaguá – Cidade de Deus, and the meteorological station of Barra Rio Centro respectively (Figure 1), of the City Hall Early Warning System, Rio de Janeiro.15
Between 1997 and 2018, the average annual rainfall in the region of the Canal do Anil basin was 1068 mm and the monthly average was 89 mm, (obtained from the pluviometric station of Jacarepaguá – Cidade de Deus). The maximum average monthly temperature was 31.2 oC and the minimum average temperature was 18.2 oC, (obtained from the local data of the City Hall Early Warning System, Rio de Janeiro (ALERTA RIO, 2019).
The water quality data and characterization of the local climate with regard to pluviometric rainfall and temperature are based on the data obtained on the estimates of the water flow in the Canal do Anil, on the days when the samples were collected. The speed of the drainage in the rectangular section control downstream from the Canal do Anil, for estimating the water flow, was obtained through the water-table fluctuation (WTF) for the following months: May, June, August, September, October and November 2018.
The data obtained were integrated in way that made it possible to assess the environmental conditions in the Canal do Anil basin, in particular the indicators for sanitation in the basin and their effects on the health of the local community.
The State Institute of the Environment (INEA, 2019), of Rio de Janeiro, provides data observed during campaigns for the collection of samples of water from the Lagoon System of Jacarepaguá, carried out in the period 2012-2018, for the determination of the water quality index (IQANSF). Figure 2 shows the average values of IQANSF for 2018 in the sampling stations of the Lagoon System of the Jacarepaguá basin, with prominence being given to sampling station AN040 of the Canal do Anil basin.
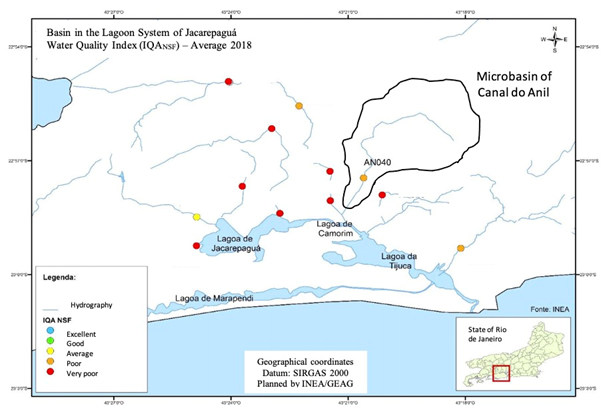
Figure 2 Average results from IQANSF in 2018 in the Lagoon System of the Jacarepaguá basin, with an emphasis on sampling station AN040, in the Canal do Anil (INEA, 2019).
Generally speaking, in 2018, the results for the water quality of the Lagoon System of Jacarepaguá showed conditions that were very unsuitable and were classified as “poor” and “very poor”, with a critical load of pollutants in the Jacarepaguá, Camorim and Tijuca lagoons.
Table 2 shows the results of IQANSF, obtained in the period 2012-2018, together with the annual and monthly classification obtained from the Canal do Anil. The collections and analyses represent measurements made on the basis of seasonal factors and resulting from the availability of resources from environmental agencies.
Year/Month |
JAN |
FEB |
MAR |
APR |
MAY |
JUN |
JUL |
AUG |
SEP |
OCT |
NOV |
DEC |
IQAANNUAL AVERAGE |
Condition |
2012 |
-- |
-- |
-- |
-- |
33.5 |
-- |
26.1 |
-- |
-- |
37.0 |
-- |
32.2 |
Poor |
|
2013 |
52.8 |
50.1 |
-- |
34.2 |
-- |
36.3 |
-- |
42.5 |
-- |
-- |
-- |
43.2 |
Poor |
|
2014 |
-- |
18.5 |
-- |
43.4 |
-- |
22.8 |
-- |
-- |
-- |
-- |
-- |
23.8 |
27.1 |
Poor |
2015 |
-- |
-- |
31.1 |
-- |
-- |
-- |
-- |
-- |
-- |
-- |
-- |
-- |
31.1 |
Poor |
2016 |
24.9 |
-- |
-- |
-- |
-- |
-- |
-- |
-- |
-- |
-- |
-- |
-- |
24.9 |
Very poor |
2017 |
21.0 |
-- |
-- |
-- |
23.3 |
-- |
-- |
-- |
-- |
-- |
23.5 |
22.6 |
Very poor M |
|
2018 |
31.3 |
-- |
-- |
-- |
-- |
-- |
-- |
-- |
-- |
-- |
28.8 |
-- |
30.1 |
Poor |
IQAmonthly average |
32.5 |
18.5 |
40.6 |
43.4 |
30.3 |
22.8 |
31.2 |
-- |
42.5 |
-- |
32.9 |
23.7 |
30.2 |
Poor |
Condition |
Poor |
Very poor |
Poor |
Poor |
Poor |
Very poor |
Poor |
-- |
Poor |
-- |
Poor |
Very poor |
Poor |
Table 2 Results and classification of the IQANSF from 2012 to 2018 in the Canal do Anil, Rio de Janeiro, Brazil (INEA, 2019)
Scale: 70-50: Average (yellow); 50-25: Poor (orange); 25-0: Very poor (red)
Following a historical series of 7 years of data analyzed in a total of 19 sampling campaigns,13 the results of IQANSF generally reveal that the condition of the water quality of the Canal do Anil was “poor”, since it was thought that the waters, as a public supply, were unfit for conventional treatment and required more advanced treatment methods. Out of a total of 19 campaigns carried out for an analysis of the water quality in the Canal do Anil river, only 2 (10%) obtained an “average” result in the IQANSF in the 1st quarter of 2013. The other results in the period 2012-2018, were assessed as “poor” or “very poor” in the IQANSF.
These results reflect the historically critical nature of the water quality data observed in the Camorim Lagoon and Tijuca Lagoon. The complete lack of collection systems and treatment plants for domestic and industrial waste in the Baixada de Jacarepaguá, directly affects the conditions for bathing in the lagoons. The mixture of organic and inorganic compounds of domestic and industrial origin, increases the degradation of the water bodies.16
From the measurements of speed and calculation of the rectangular section control downstream from the Canal do Anil, estimates of the river flow could be obtained through the water-table fluctuation (WTF), which corresponded to the collection days of each month (Table 3).
Year 2018 |
H (m) |
B (m) |
A (m²) |
T1 (s) |
T2 (s) |
T3 (s) |
Tm (s) |
L (m) |
V (m/s) |
Q (m³/s) |
25-May |
0.2 |
6.75 |
1.35 |
60 |
61 |
59 |
60 |
6.7 |
0.11 |
0.151 |
28-Jun |
0.45 |
6.75 |
3.04 |
80 |
79 |
58 |
72.3 |
6.7 |
0.09 |
0.281 |
27-Jul |
0.35 |
6.75 |
2.36 |
63 |
66 |
61 |
63.3 |
6.7 |
0.11 |
0.25 |
24-Aug |
0.33 |
6.75 |
2.23 |
38 |
40 |
35 |
37.7 |
6.7 |
0.18 |
0.396 |
27-Sep |
0.38 |
6.75 |
2.57 |
64 |
66 |
63 |
64.3 |
6.7 |
0.1 |
0.267 |
18-Oct |
0.38 |
6.75 |
2.57 |
46 |
45 |
45 |
45.3 |
6.7 |
0.15 |
0.379 |
7-Nov |
0.55 |
6.75 |
3.71 |
19 |
20 |
17 |
18.7 |
6.7 |
0.36 |
1.333 |
Table 3 Estimates of the water flow through the water-table fluctuation method in the Canal do Anil
Note: H, height of the waterline; B, width of the canal section; A, wet area; Tm, average journey time; L, distance covered; V, average speed; Q: flow
Despite the lack of data at the beginning of the year, the estimated results of the monthly flows correspond to the seasonality of the period observed, to the extent that they can be analyzed together with the volume of monthly pluviometric rainfall and the conditions of the water quality.
Table 4 and Figure 3 give information about the average monthly results obtained from the local rainfall conditions (PREC), estimated flow (Q) and water quality index (IQANSF) in the section that controls the downstream of the Canal do Anil.
Month |
JAN |
FEB |
MAR |
APR |
MAY |
JUN |
JUL |
AUG |
SEP |
OCT |
NOV |
DEC |
M ± DP |
Prec (mm) |
149 |
91 |
124 |
74 |
51 |
94 |
43 |
35 |
50 |
42 |
104 |
84 |
78 ± 35 |
Q2018 (L/s) |
ND |
ND |
ND |
ND |
151 |
281 |
250 |
396 |
267 |
379 |
1333 |
ND |
437 ± 403 |
P2018 (mm) |
220 |
200 |
80 |
42 |
17 |
54 |
27 |
64 |
41 |
63 |
180 |
42 |
86 ± 71 |
IQANSF (%) |
33 |
19 |
41 |
43 |
30 |
23 |
31 |
ND |
43 |
ND |
33 |
24 |
32 ± 8 |
Condition |
Poor |
Very poor |
Poor |
Poor |
Poor |
Very poor |
Poor |
--- |
Poor |
--- |
Poor |
Very poor |
Poor |
Table 4 Average monthly rainfall (Prec), average flow in 2018 (Q2018), rainfall in 2018 (P2018) and monthly water quality index (IQANSF) in the Canal do Anil
Note: NA, not available; A, average; SD, standard deviation

Figure 3 Relation between the pluviometric rainfall of 2018 (P2018), monthly average (Pmonthly average), estimated flow of 2018 (Q2018) and water quality index (IQANSF) in the Canal do Anil.
The seasonality factors noted with regard to the pluviometric rainfall (P2018) and the estimated flow (Q2018) did not show a direct correspondence with the water quality index (IQANSF). The variability of the rainfall patterns and the estimated flow in the months of 2018 led to relatively insignificant changes in the water quality index in the Canal do Anil, even in periods of accumulated rainfall, when there is a likelihood of a greater dilution or shifting of pollutants, as a result of heavy rainfall. For example, high rates of fecal coliforms are generally correlated with periods of heavy rainfall.17
The results obtained from the collections, together with the assays carried out through the physico-chemical and biological parameters of the samples taken from the Canal do Anil, in the 3 points analyzed, reveal a worsening of the water quality upstream and downstream with a greater concentration of total dissolved solids and turbidity, particularly at Point 3 downstream. The graphs in Figure 4 illustrate the results of the analysis in the samplings of the Canal do Anil, such as: pH, total dissolved solids (STD), turbidity (TU), dissolved oxygen (OD), cadmium and lead.
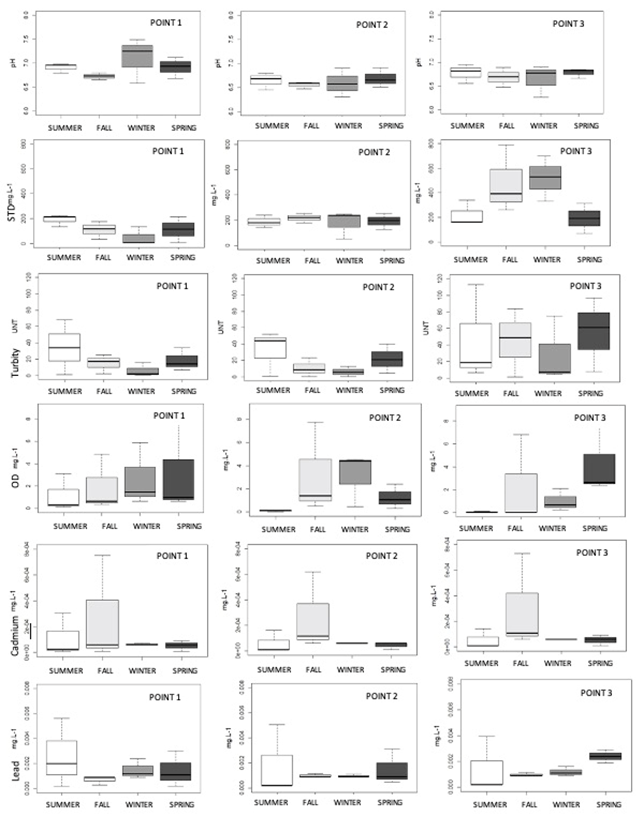
Figure 4 Boxplot of the physico-chemical parameters for the samples of the water collected in 2018, shown by season of the year in Canal do Anil.
The results of the physico-chemical parameters analyzed show that there is an increase in the concentrations of pollutant loads from Point 1 to Point 3. This can be attributed to the fact that Point 3 is further downstream from the Canal do Anil and is influenced by the increase in contributory factors like the greater amount of effluents disposed of in the River Anil, because it is close to residential and industrial areas in the locality. Moreover, marked changes in the patterns of usage and occupation have acted as a driving-force in the degradation of the water quality to the extent that seasonal variations have been noted in the domestic and industrial effluents in the water body.10
Figure 5 shows the percentage in a matrix of Pearson´s correlation coefficient, a representation of a dendrogram and an analysis of the principal components of the parameters analyzed for each sample of the Canal do Anil, such as Point 1 upstream, 2 intermediate position and 3 downstrream. The closest values to 100 indicate a strong correlation between the variables which might be positive or negative. Generally speaking, the variables lose their correlation as the volumes progress from upstream to downstream in the stretch of the canal. The dendrograms of Pearson´s correlation are formed in 2 main clusters in all 3 points. The following parameters - cadmium (CD), total dissolved solids (SDT) and electric conductivity (CE), form a common group in all the points. Another common group that was formed had the following parameters - pH, turbidity (TU) and copper (CO). Moreover, the values of r indicate a low correlation between the 2 clusters.
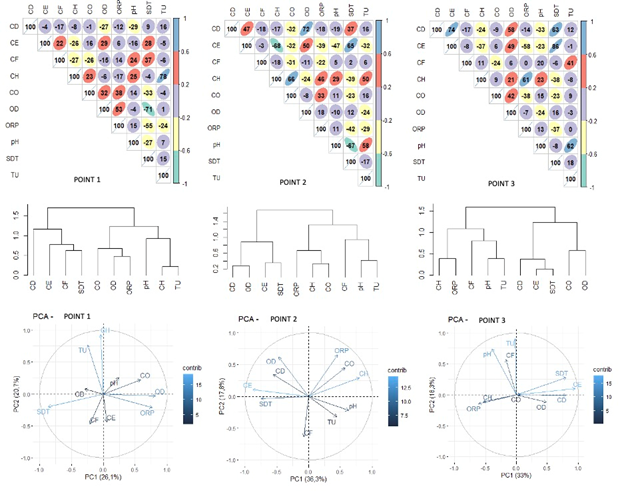
Figure 5 Correlation matrix (Pearson´s correlation coefficient in %), dendrogram and a principal components analysis (PCA) of the parameters for the sampled points in the Canal do Anil.
Although it is not a strong correlation and had a coefficient r value between 0.29 and 0.60, at the 3 points, there is an increase in electric conductivity to the extent that that it leads to a rise in the dissolved oxygen in the samples collected in the Canal do Anil. However, there is little evidence of close correlations between the analyzed parameters.
The principal component 2 (PC2) between 17.8% and 20.7% and the principal component 1 (PC1) between 26.1% and 36.6%, explains the total variance in all the points between 46.8% and 54.1%. In a general way, the dissolved oxygen (OD) had a greater effect on the water quality at Point 1 for the principal component 1, while the total dissolved solids (SDT) had lower values. In contrast, in the principal component 2 (PC2), the lead parameter (CH) had a greater importance at Point 1, while the fecal coliforms (CF) had lower values. Point 3 was notable for the fact that most of the parameters had occurrences of this phenomenon, in particular in principal component 1 (PC1), which suggests that greater values were obtained from the variables that were analyzed. In general, this analysis suggests a growing tendency for an increased presence of pollutants in the water, which was more striking at certain periods. This made possible a greater degree of chemical reactions in a concentrated form which changed the parameters for the quality of the water. It has been noted that that there has been a discharge of industrial effluent waste in the water body of the Canal do Anil, which has led to a high degree of degradation, especially because of the presence of the food industry and gasoline stations.18 In a similar way, the Rio das Velhas, in the State of Minas Gerais, also shows signs of degradation in the quality of water, especially on account of industrial and residential effluent waste.19 The environment close to industrial and urban activities poses serious challenges with regard to the pollution of water.17
However, the parameters observed at Points 1 and 2 are similar with regard to the amount of pollutants, including in different seasons of the year, which means that there is less exposure to the conditions at Point 3. Thus, the dynamics for the quality of water are driven by physical factors which vary in different temporal and spatial scales of the basin.20
These results show that there is little evidence for standardizing the pattern of behavior for the load of pollution during the seasons of the year, with the exception of the following: in Summer and Fall which can be regarded as periods with a greater capacity for cleansing the atmosphere and land surface, as well as when there is a greater demand for the use of water. Generally speaking, the quality of water in the urban rivers worsened in the dry season, particularly when there were industrial pollutants and domestic waste.21
Heat waves and heavy rainfall are more frequent in this time of year and in these conditions, there is an increased demand for water supply and a sewage system. There is also an increased risk of urban flooding and movement of materials and garbage deposited on the land surface through the use of macro and micro drainage systems. Urban expansion has had indirect consequences owing to industrialization and the reduction of green areas and this has impaired the quality of the water and affected consumer demand.22
The results of the fecal coliforms or thermotolerants at Point 1 of the collection had higher values and in accordance with the methodology employed for the assays carried out in the specialist laboratory, the parameter reached the threshold score for the microorganisms (Figure 6).
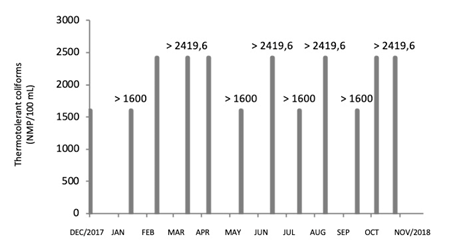
Figure 6 Results of the thermotolerant coliforms in the samples of water collected from the Canal do Anil between December 2017 and November 2018.
The high concentration of fecal coliforms can be explained by the lack of waste treatment plants in the region, and represents a high sanitary risk to public health.23 Fecal coliforms are a sign of bacterial enteric pathogens in the water caused by the disposal of residues by humans and/or animals and is closely linked to pluviometric rainfall, especially in regions that lack systems for separating rain drainage channels from the sewage system, as observed in the region of the Canal do Anil. A higher concentration of coliforms is more likely to be found in the water bodies during the rainy season.17 However, although the presence of fecal coliforms was found to have high values, it was not possible to establish an appropriate relationship with rainfall through this indicator since the methodology adopted in the laboratory does not provide an exact microbial count of the pathogens.
In accordance with the CONAMA Resolution no 274/2000 (BRASIL, 2000), thermotolerant or fecal coliforms, considered for the use of primary contact recreation, must not exceed 2500 NMP/100 mL. In the case of other uses, the thermotolerant coliforms must not exceed the threshold of 200 NMP/100 mL.
In line with the results of the water quality index in Table 4, which were shown to be poor or very poor, these limits suggest that from a microbial perspective, the water from the Canal do Anil, should probably not be used for general purposes or even for primary contact recreation for most of the year.24–26
On the basis of a seasonal assessment of the quality and quantity of the water in the Canal do Anil, in the city of Rio de Janeiro, it can be concluded that: (i) climatic and seasonal factors related to pluviometric rainfall and the river flows observed have little effect on improving the quality of water in the Canal do Anil basin, which is aggravated by the high concentration of urban, domestic and industrial pollution (ii) the quality of the water declines from upstream to downstream in the parameters for pH, total dissolved solids and dissolved oxygen, including during the different seasons of the year; (iii) the lack of basic sanitation in the region, particularly in the sewage system and regular collection of solid residues, leads to a worsening of the conditions of environmental degradation in the Canal do Anil basin, insofar as low indices for the water quality have been observed (IQANSF). It is recommended that further studies should be carried out to determine the quality of water in the Canal do Anil. This particularly applies to the kind of indicators adopted for the district of Anil, in the city of Rio de Janeiro, as a means of assessing the conditions of basic sanitation and improving the quality of life of the local community.
None.
Author declares there is no conflict of interest.

©2022 Barros, et al. This is an open access article distributed under the terms of the, which permits unrestricted use, distribution, and build upon your work non-commercially.