eISSN: 2574-9927


Research Article Volume 2 Issue 4
GV Kurdyumov Institute for Metal Physics, Ukraine
Correspondence: Gavriljuk VG, GV Kurdyumov Institute for Metal Physics, Ukraine
Received: May 07, 2018 | Published: July 23, 2018
Citation: Teus SM, Gavriljuk VG. Electron structure and thermodynamics of solid solutions in Ni–H system. Material Sci & Eng. 2018;2(4):101-109. DOI: 10.15406/mseij.2018.02.00042
The widespread concept of nickel hydride in the Ni–H system is discussed based on the first–principle atomic calculations and experimental X–ray diffraction data. The total cohesion energy in Ni–H solid solution has been determined using the density functional theory and program package Wien2k. Its dependence on hydrogen concentration is shown to be linear, which suggests the absence of any energy barrier for precipitation reaction. Moreover, the second derivative of the calculated solution enthalpy is negative within the hydrogen–to–nickel ratios, H/Ni, of 0.03 to 0.75, which is a sign of spinodal decomposition. These hydrogen concentrations are consistent with the measurements of X–ray diffraction, of which results are traditionally interpreted in terms of Ni hydride. The density of electron states has been calculated, and its non–monotonous concentration dependence correlates with that of solution enthalpy, which is also expected for spinodal decomposition. The obtained results are interpreted as miscibility gap in the Ni–H system with spinodal decomposition having the electron origin. In addition, using mechanical spectroscopy, the strain dependent internal friction has been observed in the hydrogen–charged nickel with H/Ni ratio of about 0.7. This effect is controlled by irreversible plastic deformation, which is typical for solid solutions, not for brittle chemical compounds. Finally, the “hydrides” in a number of metals are discussed in terms of two Gibb’s types of precipitation reactions.
Keywords: nickel, hydrogen, ab initio calculations, spinodal decomposition, hydride
Hydrogen in nickel attracts the essential attention of metal researchers because, like the iron and titanium, nickel constitutes the basis for one of three main classes of engineering materials and hydrogen causes lots of detrimental effects in them.
A number of studies have been devoted to hydrogen embrittlement of nickel and nickel–based alloys, see e.g.1–4 where mechanisms of brittle fracture are discussed in detail. A short–range order of hydrogen atomic distribution in the Ni–H and Ni–Fe–Cr–H solid solutions has been analyzed in the theoretical and experimental studies, e.g..5,6 Using mechanical spectroscopy, namely Snoek–Köster relaxation, the interaction of hydrogen atoms with dislocations in the hydrogen–charged single crystal nickel was thoroughly studied in7 which is the evidence for mobility of dislocations accompanied by migration of hydrogen atoms.
Not much is known so far about the electron structure of Ni–H solid solutions. One can mention the calculations in8 where, using the discrete variational method, the preferential hydrogen atom localization in the octahedral lattice sites and reduction in the interactions between surrounding nickel atoms were obtained. Remarkable is also the role of calculated H–H interaction in the atomic correlation.9 The obtained preference of dumb–bell like H–H configurations, i.e. the H–Ni–H interaction through the neighboring nickel atom, is remarkably similar to the N–Fe–N interactions in the Fe–N solid solutions, which was observed using Mössbauer spectroscopy in10 it should be underlined in this relation that both, hydrogen in nickel and nitrogen in iron, increase the density of electron states at the Fermi level, which corresponds to the increased concentration of free electrons in both metals.
A prominent event in the studies devoted to the Ni–H system was the declaration about discovery of nickel hydride in 1958, e.g..11,12 A conclusion about hydride formation in the hydrogen–saturated layer under the surface of the nickel electrode was based on the non–diffusional character of hydrogen desorption kinetics after interruption of the electrochemical charging. Using X–ray diffraction,13,14 it was shown that this new phase succeeds the fcc structure of the parent nickel, but with the increased lattice parameter by about 6%. Recently,15 the history of nickel hydride discovery was stated on the occasion of its 45 years and a stimulating effect of these pioneer works on the studies of metal–hydrogen systems has been described.
Since 1958, a number of experiments were devoted to Ni–H system and the obtained results have created a considerable base for discussion. E.g., measurements of hydrogen penetration in nickel were carried out using the electrochemical technique,16 and three different regions have been distinguished in the potential–composition curves. These regions were interpreted as corresponding to so–called a–phase existing up to the hydrogen–to–metal ratio H/Ni of about 0.03, b–phase with H/Ni of about 0.6 and the region of two phase mixture. Respectively, they were attributed to the hydrogen–depleted Ni–H solid solution, the hydrogen–rich nickel hydride and intermediate zone of transition from the first phase to the second one. Among numerous XRD studies distinguished are the in situ experiments during cathodic hydrogen charging, e.g..17 The authors recognized two “nickel hydride phases”: a–NiH with low H/Ni ratio (£ 0.03) and b–NiHx with 0.6 £ x £ 0.7. Some variation has been found in the stoichiometric coefficient x and ascribed to formation of “the hydrogen ordinary solid solution” on the base of nickel hydride. Other possible interpretations were not analyzed.
It was also shown in13,18 that decomposition of nickel hydride follows a first order kinetics, whereas the opposite result has been obtained in,19 where the non–linear behavior of the desorption rate was attributed to the effect of microstructure on the mechanism of phase transition.
The next step in studies was the saturation of nickel with hydrogen under high hydrogen pressures, e.g..20,21 Along with the measurements of electroresistivity they allowed to build the phase diagram in the broad range of temperatures and concentrations. Like it was the case for electrochemical hydrogen saturation, e.g.,16,17 three T–P areas were ascribed to hydrogen–depleted, hydrogen–rich and mixed phases, respectively. In contrast to this diagram, a crown was found in the Ni–H phase diagram obtained from the in situ measurements at high hydrogen pressures using X–rays of synchrotron radiation.22,23 The corresponding phase diagrams are presented in Figure 1. The interpretation of experimental data was proposed by the authors of20–23 in terms of nickel hydride.
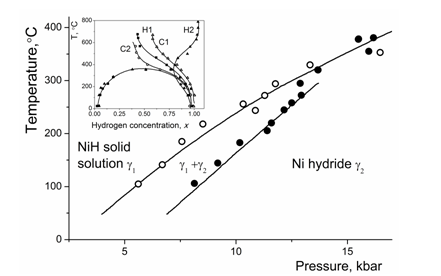
Figure 1 T-P phase diagram Ni-H constructed using high gaseous hydrogen pressures and measurements of electroresistivity, according to.20,21 In the insert, the same diagram was obtained using in situ X-ray of synchrotron radiation and diffraction measurements at different temperatures and high hydrogen pressures.22,23
However, some intriguing points in these diagrams concern the apparent existence of nickel hydride over the extended hydrogen concentration range, which could be natural for solid solutions and can be hardly imagined for chemical compounds to which class the hydrides belong. The occurrence of the crown can be interpreted as a sign for miscibility gap in the solid solutions and is not consistent with formation of chemical compounds.
The primary aim of the presented study was to clarify thermodynamics of Ni–H system based on the atomistic calculations combined with measurements of X–ray diffraction and discuss the experimental data in terms of two possible precipitation reactions in solid solutions proposed by the father of thermodynamics J. Willlard Gibbs.
Along with that, taking into account the obtained data and a number of “metal hydrides” claimed in the course of the last decades, we are going to discuss the extensive tendency to delete the border between hydrides and solid solutions.
Ab initio calculations of hydrogen effect on the electron structure of nickel were performed within the framework of Density Functional Theory (DFT)24,25 using the Wien2k program package.26 According to this theory, the total energy of a studied system, Etot, is presented as a sum of the kinetic energy between non–interacting particles, electron–electron repulsion energy, nuclear–electron attraction energy, an exchange–correlation term and Coulomb repulsive energy of the fixed nuclei.
For the accurate description of the exchange and correlation effects, the Generalized Gradient Approximation (GGA)27 was used. The convergence tests were performed to find optional values of wave functions in the basis set and the number of k–points which are used for Brillouin zone sampling according to the Monkhorst–Pack scheme.28 The wave functions in the unit cell are the spherical ones for the region inside atomic spheres, i.e. ion cores, and the plane waves for the interstitial regions. Such approach gives a necessary flexibility for the basis set, which results in a quicker convergence during the calculations in comparison with the single–type basis and in the better description of the core states.
The unit cell for calculations consisted of 32 nickel atoms with variable quantity of hydrogen atoms to cover a wide range of hydrogen concentrations. In all cases, the spin polarization effects were also included to take into account the magnetic contribution to the total energy. Brillouin zone integration was constructed with the 15´15´15 k–point mesh. For proper comparison, the muffin–tin radii of nickel and hydrogen atoms, Rmt(Ni) = 2.08 Bohr and Rmt(H) = 1.12 Bohr, were kept constant in the calculations of different atomic configurations. The magnitude of the largest vector G in the Fourier expansion was equal to 20. For accurate determination of atomic positions, the force convergence was set to be 0.1 mRy/a.u. with the interatomic forces between the atoms smaller than 2 mRy/a.u. To find the equilibrium lattice constants, the Murnaghan’s equation of state from Ref.29 was used by fitting the total energy versus the unit cell volume.
To determine the solution enthalpy of hydrogen atoms in the nickel lattice, the following equation was used:
(1)
where Etot are total energies of corresponding cells after all types of relaxation (volume, shape, atomic positions) and EH2 is a total energy of the hydrogen molecule, which is calculated by putting two hydrogen atoms in a cubic box with quite large length (20 Bohr) to exclude any possible interactions which can arise because of periodic boundary conditions. Such calculations result in the bond length distance of 0.751 Å, binding energy of 4.70 eV and vibrational frequency of 4270 cm–1, which is in a good consistency with the available experimental values of 0.741 Å, 4.75 eV and 4395 cm–1.30
The phonon effects and thermodynamic functions were calculated using Phonon software31,32 within the harmonic approximation. To include the effects concerned with phonons, the dynamical matrix has to be constructed. The elements of such matrix are the force constants that could be obtained from the ab initio calculations according to the direct method33,34 and its modification.32 Afterwards, by constructing the phonon density of states, thermodynamic functions could be determined. Using such approach, the zero–point energy corrections for the systems with hydrogen atoms should be taken into account. In a simplest approximation, the force constants concerned with the displacements of nickel atoms from their equilibrium positions can be equal to zero because the mass of the nickel atom is significantly larger than that of the hydrogen atom. After diagonalization of the Hessian matrix, the normal mode frequencies of hydrogen atoms can be obtained and the zero–point energy can be calculated by summing up the zero–point vibrational energies where is a real normal mode frequency.
X–ray diffraction has been used to estimate a change in the lattice parameters caused by hydrogen dissolution in the nickel. A pure nickel plate of 0.5mm in thickness was saturated with hydrogen at room temperature in the aerated 1N H2SO4 solution containing 0.01 g/l NaAsO2 with the current density of 50mA/cm2 for 72 hours. A platinum foil served as the anode. After cathodic charging, the specimens were put into liquid nitrogen to prevent hydrogen degassing. Specimen was installed into the holder of X–ray diffractometer for time less than 120 s. The measurements were carried out in Co radiation using Huber diffractometer with one–circle Q–2Q goniometer and operating voltage of 30 kV. A computer program controlled the angular movement of both goniometer and counter.
A cryosystem LN–3 produced by Cryo Industries of America Inc. was used for measurements at low temperatures. In contrast to standard cryostats, this system allows the rapid cooling of the sample by the liquid nitrogen flow and measurements at any temperature within the range of +90 °C to –196 °C. The chosen temperature was equal to -155 °C. For hydrogen degassing, the sample in the diffractometer holder was heated to RT or higher temperatures, held at this temperature for 10 to 15 min and cooled again down to –155 °C for further measurements.
The strain–dependent internal friction was used to test mobility of dislocations in the hydrogen–charged nickel at hydrogen contents typical for “Ni hydride”. An inverted pendulum equipped with programming the measurement control and the automatically recorded experimental data was used for measurements at the frequencies of mechanical vibrations in the range of about 3 Hz, the heating rate of 1.5 K/min and the strain amplitudes of ~10–6 to 5×10⁻⁴.
Ab initio calculations
The comparison of possible positions for hydrogen atoms in the nickel lattice in terms of energy reveals that they prefer to occupy octahedral interstitial sites in the Ni fcc lattice within all the range of studied hydrogen concentrations. This result is consistent with a huge array of experimental data obtained by means of X–ray diffraction measurements.14,35
Figure 2 demonstrates the total cohesion energy of the calculated Ni–H ensemble in its dependence on hydrogen concentration.
It was defined as a difference between the calculated total energy per ensemble and the sum of the total energies of free atoms included in this ensemble, , where summation is performed over the all included atoms. Thus, the total cohesion energy characterizes the potential energy of all the interatomic bonds in the studied structure and corresponds to thermodynamic stability of the Ni–H system. According to this Figure, the total cohesion energy monotonically increases in its module with increasing hydrogen concentration in the nickel lattice, which is due to formation of new bonds between the hydrogen and host atoms.
The calculated enthalpy of hydrogen dissolution that includes the zero–point energy correction is presented in Figure 3a. As follows from its concentration dependence, the solution enthalpy increases with increasing H/Ni ratio up to 0.25 and, thereafter, decreases. The second derivative of the solution enthalpy is presented in Figure 3b. As seen, it acquires the negative sign in the concentration range of H/Ni in between 0.03 and 0.75.
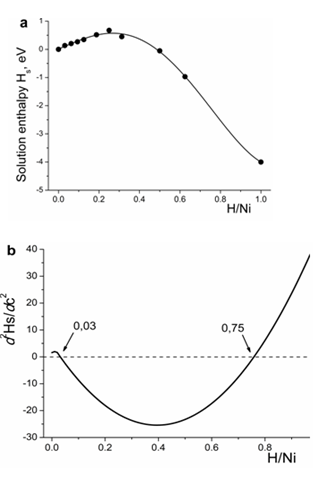
Figure 3 Variation in the hydrogen solution enthalpy for Ni-H system with increasing hydrogen content (a). Second derivative of the solution enthalpy as a function of hydrogen content (b).
According to the obtained results, the solution enthalpy of one hydrogen atom in the nickel lattice amounts to 0.14 eV, which corresponds to the available experimental data.36–38 Nevertheless, some remarks should be given here. Usually, the measurements of solution enthalpy are being carried out at elevated temperatures and the extrapolation of experimental data to the low temperature range should be done to allow a correct comparison with the data obtained by means of ab initio calculations. In,39 the analysis of a large array of experimental data has been carried out and it was shown that the heat of hydrogen solution in nickel tends to be increased with increasing temperature.
The calculated total density of states, DOS, for the spin up and spin down electron states in the NiHx system is shown in Figure 4a & Figure 4b in comparison with that in the pure nickel. A detailed behavior of the DOS in the vicinity of the Fermi level is shown in the insert to each Figure. In case of pure nickel, the bonding and antibonding states for the spin up channel are almost completely filled, whereas for the spin down channel the antibonding states are only partly filled.
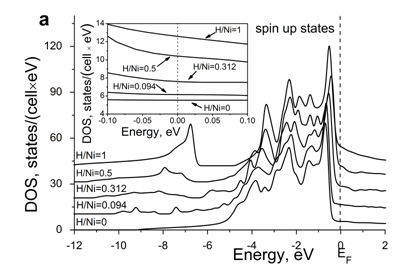
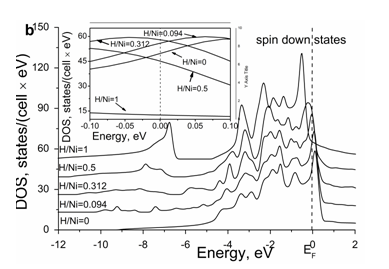
Figure 4 Concentration dependence of density of electron states for spin up (a) and spin down (b) in the Ni-H system in comparison with that in the pure Ni.
The interaction between nickel and hydrogen atoms causes the appearance of bonding states at the bottom of the metallic d–band. The analysis of partial contributions to the total DOS from the electrons of different atoms and different symmetries reveals that the Ni 4s and H 1s electrons are fully overlapping and form the Ni–H bonds. Because of degeneration, the 3d orbital is split into eg and t2g groups which are different in their symmetry. According to the obtained results, the 3d eg electrons also contribute to the Ni–H bonds, whereas the 3d t2g electrons are localized and do not take part in the Ni–H interaction.
The effect of hydrogen on the DOS at the Fermi level is remarkable see Figure 4. With increasing hydrogen content, it increases moderately and monotonously for the majority spin channel (Figure 4a), whereas its behavior is non–monotonous for the minority spin channel (Figure 4b).
The corresponding concentration dependences of spin up and spin down electron states and their total values are presented in Figure 5. Up to the H/Ni ratio of about 0.27, the DOS at the Fermi level for the minority channel and the total DOS increase, however, above this hydrogen concentration, they decrease. Such a substantial decrease in the DOS at the Fermi level is caused by the filling of the antibonding states. It explains the magnetic behavior of the H–saturated nickel which becomes paramagnetic at high hydrogen contents according to the experimental data.40
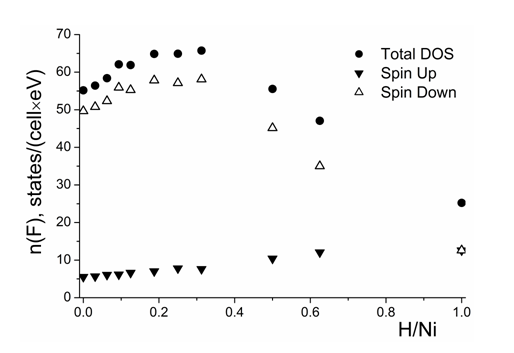
Figure 5 Density of states at the Fermi level as a function of hydrogen concentration for different spin orientations.
The phonon contribution was calculated within the frame of harmonic approximation. As follows from the obtained data, with increasing hydrogen content, it does not change the general behavior of free energy within the studied temperature range, see Figure 6. This is an indication that precipitation reaction in the Ni–H solid solutions has the electron nature.
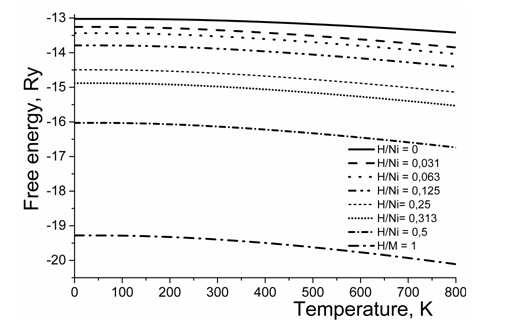
Figure 6 Temperature dependence of Helmholtz free energy for different hydrogen concentrations in Ni-H system.
X–ray diffraction
X–ray diffraction patterns measured at -155°C after installation of the hydrogen–charged sample into the holder and successive heating procedures are presented in Figure 7. The intensive peak (111)ga and rather small peak (111)g1 are recorded just after sample installation. Heating during the first and second stages of hydrogen degassing due to holding at 295 K for 10 min, respectively, shift the (111)ga peak to the position (111)gb and, then, to g2, whereas the intensity of peak (111)g1 increases without a visible change in its position. Further stages of hydrogen degassing due to holding of the sample at RT and higher temperatures result in the exchange of peak intensities between g2 and g1, of which positions remain to be stable within the error of measurements.
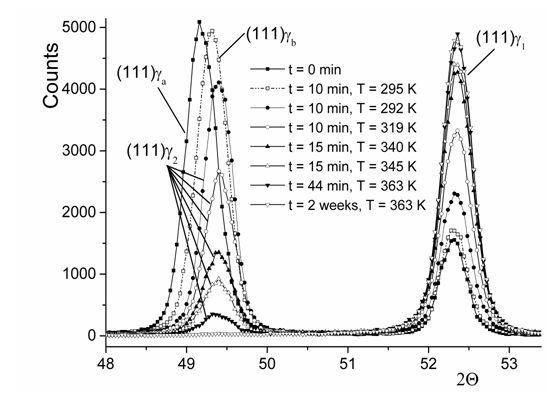
Figure 7 X-ray diffraction in the hydrogen-charged nickel. Measurements were performed at 155 5C with successive intermediate holdings at higher temperatures for a certain period of time.
The obtained lattice parameters are 3.725 Å, 3.715 Å, 3.710 Å and 3.514 Å for, ga, gb, g2 and g1, respectively. Using the data for hydrogen effect on dilatation of metals with the fcc crystal lattice, as proposed by Baranowski et al.41 one can estimate the atomic ratio H/Ni as 0.73 for ga, 0.69 for gb, 0.67 for g2 and 0.02 for g1 with the accuracy of ±0.005. The H/Ni ratio ng1, as determined from the presented measurements, is close to the H/Ni = 0.03 obtained in our ab initio calculations and consistent with a number of available experimental studies. Finally, the sample was heated up to 90 °C for 10 min and thereafter held for two weeks at RT. The peak g2 has disappeared, whereas position of peak (111)g1, as measured again at -150 °C, was practically not changed.
Mechanical spectroscopy
The idea to test mobility of dislocations in the nickel with the H/M ratio of about 0.7, as usually determined for “nickel hydride”, is based on the concept that brittleness of hydrides does not suggest any remarkable dislocation slip. The obtained data of internal friction are presented in Figure 8.
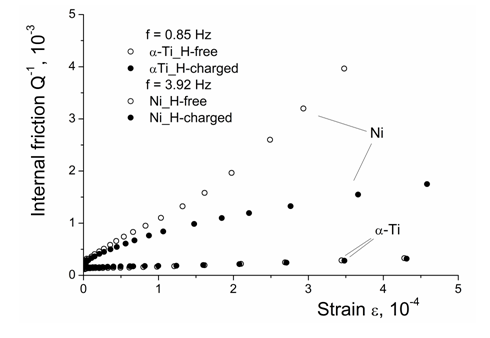
Figure 8 Amplitude-dependent internal friction in the H-charged and H-free Ni in comparison with that for -Ti.
The strain–dependent internal friction is caused by the vibrations of dislocations under applied stress. Moreover, it is caused by the emission of new dislocations and their slip, if the applied stress exceeds the elasticity limit, of which above dislocation sources start. The damping intensity is proportional to the area crossed by dislocations in the course of their vibrations and slip. Below the elasticity limit, damping represents so–called internal friction background which exponentially increases with increasing temperature.42,43
The strain–dependent internal friction in the nickel and titanium chosen for comparison, both hydrogen–free and hydrogen–charged, is presented in Figure 8. Unlikely to results obtained in hydrogen–charged iron–based solid solutions,44 for austenitic steels, the observed ADIF does not contain a small initial part where the damping is independent of the applied stress. In other words, the start of dislocation sources, i.e. the irreversible plastic deformation, cannot be detected in nickel by means of ADIF. A reason for that is a high concentration of free electrons in nickel in comparison with the iron and, correspondingly, the enhanced metallic character of interatomic bonds causing the low shear modulus and, correspondingly, a decreased start stress of plastic deformation.
According to Figure 8, the dislocation slip occurs in the H–free and H–charged nickel and does not occur in the a–titanium, whatever H–free or H–charged.
Thermodynamical basis for transformations in the Ni–H solid solution
According to classical theory of solid solutions and in consistency with J. W. Gibbs, two types of precipitation reactions are possible.45 In the first type (Figure 9), the Gibbs energy of a oversaturated solid solution cannot be spontaneously reduced to its minimum at given temperature because the curvature of the free energy versus composition curve is always positive.
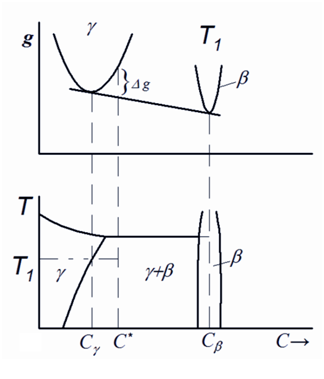
Figure 9 Gibbs energy and corresponding fragments of the phase diagram as function of chemical compositions and temperature for the cases of precipitation of a chemical compound. C -equilibrium concentration, C* - oversaturation concentration., C - concentration in the precipitation phase.
In this case, the Gibbs energy can be decreased only if a new distinctly different phase with lower energy and different crystal lattice is nucleated. This type of precipitation reaction is characterized by some energy barrier which should be overcome to initiate the nucleation process. For example, just this reaction occurs during saturation of the iron with gaseous nitrogen at high pressures resulting in precipitation of the g´–nitride Fe4N.46
In the second type of precipitation reactions see in Figure 10, the Gibbs energy is characterized by a single curve with one maximum and two local minima, which is resulted from some positive energy term added to the free Gibbs energy for an ideal solid solution and causing the immiscibility of solid solutions.
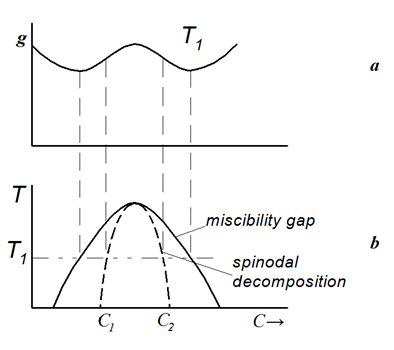
Figure 10 The same as in Figure 9 for the case of miscibility gap in the oversaturated solid solution.
Phases belonging to this single curve have the same type of the crystal lattice and differ only in the concentration of solute elements. As a result, below some critical temperature denoted as a consolute point, the solid solution is decomposed into two phases of fixed compositions which depend on the temperature. In the concentration range between the inflection points on the free energy curve, the mechanism of such reaction is the spinodal decomposition.
As follows from the concentration dependence of the total cohesion energy, as presented in Figure 2, its module increases monotonically with increasing hydrogen content in Ni. The absence of any deviations from its linear behavior suggests that the precipitation reaction proceeds without any energy barrier.
The absence of energy barrier and the identity of the crystal structures in “nickel hydride” and the parent nickel give the evidence that the dependence of free energy on the hydrogen content should be described by a single curve belonging to both phases, as shown in Figure 10.
Moreover, the non–monotonous behavior of hydrogen solution enthalpy with increasing hydrogen content, as presented in Figure 3a, and its negative second derivative within the H/Ni ratio in between the values of 0.03 and 0.75 are important signs that the precipitation reaction occurs via spinodal decomposition. Within this concentration range, the hydrogen solid solution is decomposed into the hydrogen–rich and hydrogen–depleted phases of fixed compositions on the spinodal reaction.
It is interesting to compare the results of calculations with the experimental data obtained by Baranowski et al.,15 where the electrical resistance of nickel was measured as a function of gaseous hydrogen pressure. A significant change in the electroresistivity was observed if the hydrogen pressure has exceeded 6 kbar, which was attributed by the authors to the formation of the hydride phase. Using the expression for hydrogen concentration, as derived in,47 and taking into account the hydrogen solution enthalpy obtained in our calculations, the H/Ni ratio corresponding to the start of such sudden decrease in the electroresistivity can be estimated as
(2)
Where is a constant, F is a fugacity, R is the gas constant, is an enthalpy for dissolution of hydrogen atom in a metal and T is a temperature. The H/Ni ratio of 0.07 is obtained from this estimation. It falls into the above calculated concentration range for the existence of two solid solutions resulted from spinodal decomposition and is close to its low limit.
It was shown earlier that the spinodal decomposition has an electron origin, e.g.48–51 Accordingly, a correlation should exist between some parameters describing the electron structure of a system and its inclination to spinodal decomposition. Within the rigid band approximation, the second derivative of the solution enthalpy correlates with the DOS at the Fermi level via the following equation:
(3)
Generally, the rigid band model fails to describe the spinodal decomposition. Nevertheless, the inverse proportionality between solution enthalpy and DOS at Fermi level was confirmed to exist, e.g. in.48,50 The identical character of the concentration behavior for second derivative of the solution enthalpy and the DOS at the Fermi level, see Figure 3 & Figure 5, respectively, is consistent with the inverse proportionality between the components of Eq. (3) for the Ni–H system.
Comparison with available experimental data
Mechanical spectroscopy, namely the strain–dependent internal friction provides a possibility to roughly estimate the strength of atomic interactions in hydrogen–charged nickel at hydrogen content equal to that in “Ni–hydride”. Metal hydrides are brittle compounds and play an important role in the hydrogen embrittlement of metallic materials. As follows from the data presented in Figure 8, the dislocations in “Ni–hydride” are quite mobile, which is not the case for the hydrogen–charged a–titanium where the hydride is really formed and causes brittle fracture.
Generally, hydrogen in metallic solid solutions increases mobility of dislocations, which is caused by the hydrogen–increased concentration of free electrons resulting in the decrease of the specific energy of dislocations, their line tension. It is relevant to note in this relation that, in contrast to hydrogen in the iron–based solid solutions, see,44 mobility of dislocations is decreased by hydrogen in nickel. The difference can be related to spinodal decomposition, i.e. to the coexistent of two alternatively located solid solutions with strikingly different hydrogen contents and, correspondingly, different specific volumes and initiated stresses. No miscibility gap is observed for hydrogen in the iron–based solid solutions.
The obtained X–ray diffraction data along with the results of atomistic calculations allow to propose a quite different interpretation of the precipitation reaction in Ni–H system.
In fact, just after installation of the H–saturated sample into the holder and the first stage of hydrogen degassing see Figure 7, the diffraction pattern contains the peak g1, of which position coincides with that of a pure nickel, and peaks (111)ga and (111)gb belonging to the ordinary H solid solution. After subsequent series of hydrogen degassing, diffraction patterns reveal the coexistence of two hydrogen solid solutions in nickel, g1 and g2.
The hydrogen degassing is accompanied by the change in their fractions, whereas hydrogen concentrations remain unchanged. In other words, the figurative point in the Ni–H phase diagram shifts in the course of hydrogen degassing along the conode towards the decreased total hydrogen content within the crown which borders the T–C area of miscibility gap.
Let us compare the proposed interpretation with the features of the phase diagrams for Ni–H system obtained in20–23 and presented in Figure 1. The T–P diagram was obtained based on the hydrogenation under gaseous hydrogen pressures up to 20 kbar, subsequent cooling to low temperatures and measurements of electroresistivity.20,21 The T–C diagram, see insert in Figure 1, was constructed using in situ X–ray measurements of synchrotron radiation at high hydrogen gaseous pressures at 1.1 to 5.4 GPa during heating and cooling.22,23
The diagram from20,21 contains the phase g1 with the low hydrogen content, the “nickel hydride” g2 having high hydrogen content and the intermediate area where the g1 to g2 transition proceeds. As already noted in the Introduction, the following remarks can be made in relation to the author’s interpretation of their T–P diagram: (i) the nickel hydride exists in a broad area of hydrogen contents, whereas chemical compounds are expected to have a stoichiometric composition or the solid solution can be formed within the narrow concentration range with small deviations from the stoichiometry; (ii) with increasing temperature, the intermediate area is narrowing and the border curves g2 and g1 intersect each other, which is a sign for the crown in the phase diagram; (iii) if so, what a phase is thermodynamically stable at temperatures above 400 °C: g1 or g2?
The diagram obtained in22,23 clearly shows the crown of miscibility gap with the consolute temperature Tc of 360 ºC, whereas the only H solid solution exists within the whole concentration range above Tc.
It is relevant to note that a similar phase diagram is found for the Pd–H system and its interpretation is also proposed in terms of “Pd hydride”.52–54 The –phase, i.e. Pd hydride, is claimed to exist within the frame of high hydrogen contents, whereas the –phase, or –hydride, with the same crystal lattice is observed at low hydrogen contents, and the both phases coexist within the crown with the consolute temperature Tc of about 300 ºC. Above Tc, the – and –phases coexist without any phase borders in the phase diagram, like it occurs in the T–P Ni–H diagram.
Very interesting results were obtained in the experiments where the saturation of palladium with hydrogen was carried out at temperatures below or above Tc53,54 a strong hardening and surface relief due to the intersection of the 2–phase region at temperatures below Tc, and the absence of both hardening and surface relief above Tc. It seems clearly that this effect occurs due to difference in specific volumes of two solid solutions within the area of miscibility gap and it is absent above Tc within the area of the homogeneous solid solution.
Metal hydrides and thermodynamics
Let us finally analyze the data about a number metal hydrides claimed to be formed under high hydrogen pressures in a number of metals, e.g., Cr, Mn, Fe, Co, Ni, Mo, Tc, Rh, Pd, Re.55–58 All these hydrides have been shown to exist within a broad range of hydrogen contents. In case of Co, Ni, Rh, Pd, they have the crystal lattices identical with those of parent metals, which suggests that, in fact, they are just oversaturated solid solutions.
In contrast, the hydrides in systems Ti–H and Zr–H have definite stoichiometric chemical compositions. Their crystal lattices are different from those of parent metals, which corresponds to the above mentioned first type of the Gibbs’ precipitation reactions.
In case of Cr, Mn, Fe and Mo, the hydrogen–induced transformation proceeds. Again, these “hydrides” with the hcp crystal lattice exist in the wide concentration range, which is also a sign of the solid solutions, not of chemical compounds.
It is useful to refer in this relation to the Fe–N phase diagram.46 In many aspects, nitrogen and hydrogen in metals are similar in their effect on the crystal structure, phase transformations and properties. The both elements increase the density of electron states at the Fermi level59 and, correspondingly, increase the concentration of free electrons,60,61 cause the transformation62 and affect iron properties in a similar way.63,64
Like hydrogen, nitrogen is a volatile element, and the both are negligibly dissolved in the iron. Like the Fe–H phase diagram, the Fe–N one is constituted not for pN2 = 1 bar, but for very high partial pressures of nitrogen provided by the dissociation of ammonia. In fact, it is a projection of various equilibrium states in the temperature–pressure–concentration diagram onto the temperature–concentration plane.
The solid solution of nitrogen in the hcp –iron is found within the broad range of nitrogen contents starting from 25.8 at.%. It reveals a long–range atomic ordering resulting in the superstructure Fe2N at 33 at.% with small deviations from the stoichiometry within the narrow concentration range. This superstructure is conventionally denoted as z–nitride.
Nevertheless, so far, no attempts have been undertaken to apply term “nitride’ to the whole concentration range of the hcp Fe–N solid solution. Therefore, there are no convincing arguments to denote as hydrides the oversaturated hydrogen solid solutions obtained artificially under high hydrogen pressures and having no inherent signs of the chemical compounds.
Using ab initio atomic calculations, the study of the Ni–H system has been carried out. It is shown that the total cohesion energy of the calculated structure monotonically depends on hydrogen concentration, which suggests that the precipitation reaction in this system occurs without any energy barrier. This result and the identity of the crystal lattices of the parent metal and the precipitate indicate that the free energy–concentration dependence of both phases is described by a single curve in accordance with the Gibb’s second type of precipitation reaction in the oversaturated solid solutions.
Moreover, the second derivative of the solution enthalpy has a negative sign within the range of the hydrogen concentrations of 0.03 to 0.75, which is the evidence for decomposition of the solid solution within this concentration range via spinodal mechanism.
This result is confirmed by the obtained X–ray diffraction data and consistent with those available in the literature. According to the data of strain–dependent internal friction, dislocations in “Ni–hydride” are manifestly mobile at variance with that in hydrogen–charged –titanium where Ti–hydride is really formed.
The analysis of a number studies of “metal hydrides” apparently obtained under high gaseous hydrogen pressures leads to the conclusion that, in their majority, the formation of oversaturated solid solutions or the phase transformation between two solid solutions occurs.
Author declares there is no conflict of interest.

©2018 Teus. This is an open access article distributed under the terms of the, which permits unrestricted use, distribution, and build upon your work non-commercially.